
Topic – Fake News Classifier with NLP Classify News as Real or Fake with Natural Language Processing
Fake news turns you crazy right?!
Undoubtedly YES!
As Artificial Intelligence is designed to perform all the tasks a human can do in a machine-understandable way, NLP – the proud child of AI comes here to play!
Here in this article, we will work with Fake News Classification with NLP.
We will take a dataset with real and fake labeled news, and make our NLP- algorithm learn to classify data as real or fake!
Before getting into details, let me note down the steps involved, which will help you easier to navigate through the blog.
In Fake News Classifier with NLP, we will cover the following steps-
- Importing, loading, preprocessing, and analyzing the data
- Vectorizing our data
- Use Suitable Machine Learning Models for Classifying News
- Finally, conclude by opting for the best model for News Classification
Dataset – Download the data from here.
Prerequisites for Fake News Classifier with NLP-
- Programming language- Python 3x
- Libraries – NumPy, Pandas, Sklearn, Matplotlib
- IDLE – Jupyter Notebook/Spyder/Google Colab (preferred)
So, let’s get started!
Step 1: Importing, loading, preprocessing and analyzing the data
Let us first import all the necessary libraries.
def warn(*args, **kwargs):
    pass
import warnings
warnings.warn = warn

# Handle table-like data and matrices
import numpy as np
import pandas as pd

# Computations
import itertools

# Modelling Algorithms
from sklearn.naive_bayes import MultinomialNB
from sklearn.linear_model import LogisticRegression
from sklearn.linear_model import PassiveAggressiveClassifier

# Modelling Helpers
from sklearn.model_selection import train_test_split
from sklearn.feature_extraction.text import TfidfVectorizer
from sklearn.feature_extraction.text import CountVectorizer
from sklearn import metrics

# Visualization
import matplotlib.pyplot as plt
Next, we will load the data, that we downloaded, a while ago, from Kaggle.
train = pd.read_csv("train.csv")
test  = pd.read_csv ("test.csv")
train.head()
You will see that the data is loaded properly, as a table with rows and columns appear.
Great! Further, we will get some details and description of the dataset for further tasks.
print(f"Train Shape : {train.shape}")
print(f"Test Shape : {test.shape}")
Let’s look at the output.
Train Shape : (20800, 5)
Test Shape : (5200, 4)
Alright, it is now time to get with some data analysis and data preprocessing.
train.info()Output-
<class 'pandas.core.frame.DataFrame'>
RangeIndex: 20800 entries, 0 to 20799
Data columns (total 5 columns):
 #   Column  Non-Null Count  Dtype
---  ------  --------------  -----
 0   id      20800 non-null  int64
 1   title   20242 non-null  object
 2   author  18843 non-null  object
 3   text    20761 non-null  object
 4   label   20800 non-null  int64
dtypes: int64(2), object(3)
memory usage: 812.6+ KB
It printed all information about the train data.
Let us dig more information.
train.isnull().sum()It outputs-
id           0
title      558
author    1957
text        39
label        0
dtype: int64
So, we can see that we have a lot of null values or missing values.We need to solve this issue.
# Handle missing values
test=test.fillna(' ')
train=train.fillna(' ')
Yay! No more missing values!
If the model is trained on a concatenation of the title, the author and the main text, the model would be more generalized because adding more words to the input might increase the reliability of the model.
# Create a column with all the data available
test['total']=test['title']+' '+test['author']+' '+test['text']
train['total']=train['title']+' '+train['author']+' '+train['text']
Great job! Now we need to perform the last step of data preprocessing- Dividing the data into train, test and split!
# Dividing the training set by using train_test_split
X_train, X_test, y_train, y_test = train_test_split(train['total'], train.label, test_size=0.20, random_state=0)
And we are all set! In the next step, we will vectorize our text data.
Step 2: Vectorizing our data for Fake News Classifier with NLP
A machine cannot understand the human language! Thus we need to convert text data to numerical vectors, for further computations.
# Initialize the `count_vectorizer`
count_vectorizer = CountVectorizer(ngram_range=(1, 2), stop_words='english')
# Fit and transform the training data.
count_train = count_vectorizer.fit_transform(X_train)
# Transform the test set
count_test = count_vectorizer.transform(X_test)

#Initialize the `tfidf_vectorizer`
tfidf_vectorizer = TfidfVectorizer(stop_words='english', ngram_range=(1, 2))
#Fit and transform the training data
tfidf_train = tfidf_vectorizer.fit_transform(X_train)
#Transform the test set
tfidf_test = tfidf_vectorizer.transform(X_test)
Awesome! Our text data is perfectly vectorized now!
Let’s quickly jump to the next section, where we will build our NLP models!
Step 3: Use Suitable Machine Learning Models for Classifying News
1. Multinomial Naive Bayes with Count Vectorizer (BagofWords)
Naive Bayes is mostly used in natural language processing, for its easy approach to solving classification tasks using Bayes’ Theorem.
According to our data, the class is 0 or 1, where 0 implies fake news and 1 implies true news. Given a news x, we will compute P(true news|x) as well as P(fake news|x).
If P(true news|x) > P(false news|x), the algorithm predicts it is a true news. Otherwise, the news will be predicted as fake.
nb_classifier = MultinomialNB(alpha = 0.1)
nb_classifier.fit(count_train, y_train)
pred_nb_count = nb_classifier.predict(count_test)
acc_nb_count = metrics.accuracy_score(y_test, pred_nb_count)
print(acc_nb_count

# tune the hyperparameter alpha for the naive bayes classifier
for alpha in np.arange(0,1,.05):
    nb_classifier_tune = MultinomialNB(alpha=alpha)
    nb_classifier_tune.fit(count_train, y_train)
    pred_tune = nb_classifier_tune.predict(count_test)
    score = metrics.accuracy_score(y_test, pred_tune)
    print("Alpha: {:.2f} Score: {:.5f}".format(alpha, score))
Let’s look at the accuracy score.
Alpha: 0.00 Score: 0.91106
Alpha: 0.05 Score: 0.94183
Alpha: 0.10 Score: 0.94255
Alpha: 0.15 Score: 0.94279
Alpha: 0.20 Score: 0.94231
Alpha: 0.25 Score: 0.94111
Alpha: 0.30 Score: 0.93990
Alpha: 0.35 Score: 0.93822
Alpha: 0.40 Score: 0.93750
Alpha: 0.45 Score: 0.93630
Alpha: 0.50 Score: 0.93510
Alpha: 0.55 Score: 0.93486
Alpha: 0.60 Score: 0.93341
Alpha: 0.65 Score: 0.93149
Alpha: 0.70 Score: 0.93029
Alpha: 0.75 Score: 0.92909
Alpha: 0.80 Score: 0.92788
Alpha: 0.85 Score: 0.92644
Alpha: 0.90 Score: 0.92428
Alpha: 0.95 Score: 0.92308
Woah! The best score is obtained for alpha = 0.15, and is equal to 0.94279. It is able to classify fake news with an accuracy of 94.27%!
Let us check the confusion-matrix to see true positives and false negatives, which shows how much correctly it is predicting.
# Let's re-run our fine-tuned model and plot the confusion matrix
nb_classifier = MultinomialNB(alpha = 0.15)
nb_classifier.fit(count_train, y_train)
pred_nb_count = nb_classifier.predict(count_test)
cm = metrics.confusion_matrix(y_test, pred_nb_count, labels=[0,1])

# Creating a function that outputs a confusion matrix
def plot_confusion_matrix(cm, classes,
                          normalize=False,
                          title='Confusion matrix',
                          cmap=plt.cm.Blues):

    plt.imshow(cm, interpolation='nearest', cmap=cmap)
    plt.title(title)
    plt.colorbar()
    tick_marks = np.arange(len(classes))
    plt.xticks(tick_marks, classes, rotation=45)
    plt.yticks(tick_marks, classes)
    thresh = cm.max() / 2.
    for i, j in itertools.product(range(cm.shape[0]), range(cm.shape[1])):
        plt.text(j, i, cm[i, j],
                 horizontalalignment="center",
                 color="white" if cm[i, j] > thresh else "black")

    plt.tight_layout()
    plt.ylabel('True label')
    plt.xlabel('Predicted label')


plot_confusion_matrix(cm, classes=['TRUE','FAKE'], title ='Confusion matrix for a MultinomialNB with Count Vectorizer')
Look at the matrix carefully!

We see that although our model has a general accuracy of 94.3 %, which is good. But it does not really score well in view of number of false negative. 223 fake news are classified as true news with this model, which is not pleasing to see.
Next, we will try to use the Tf-IDF vectorizer on this same model to see if it performs better.
2. Multinomial Naive Bayes with TF-IDF Vectorizer
nb_classifier = MultinomialNB(alpha = 0.1)
nb_classifier.fit(tfidf_train, y_train)
pred_nb_tfidf = nb_classifier.predict(tfidf_test)
acc_nb_tfidf = metrics.accuracy_score(y_test, pred_nb_tfidf)
print(acc_nb_tfidf)


# tune the hyperparameter alpha for the naive bayes classifier
for alpha in np.arange(0,0.1,.01):
    nb_classifier_tune = MultinomialNB(alpha=alpha)
    nb_classifier_tune.fit(tfidf_train, y_train)
    pred_tune = nb_classifier_tune.predict(tfidf_test)
    score = metrics.accuracy_score(y_test, pred_tune)
    print("Alpha: {:.2f}  Score: {:.5f}".format(alpha, score))
Let’s see the scores.
Alpha: 0.00  Score: 0.90649
Alpha: 0.01  Score: 0.94375
Alpha: 0.02  Score: 0.94375
Alpha: 0.03  Score: 0.94159
Alpha: 0.04  Score: 0.93966
Alpha: 0.05  Score: 0.93822
Alpha: 0.06  Score: 0.93462
Alpha: 0.07  Score: 0.93317
Alpha: 0.08  Score: 0.93005
Alpha: 0.09  Score: 0.92861
At alpha=0.01-0.02 it gives the best score, i.e. 94.37!
Coming to the crucial part, we will check the confusion matrix now.
# Let's run the optimized model with best value of hyperparameter and check the confusion matrix
nb_classifier = MultinomialNB(alpha = 0.01)
nb_classifier.fit(tfidf_train, y_train)
pred_nb_tfidf = nb_classifier.predict(tfidf_test)
cm2 = metrics.confusion_matrix(y_test, pred_nb_tfidf, labels=[0,1])
plot_confusion_matrix(cm2, classes=['TRUE','FAKE'], title ='Confusion matrix for a MultinomialNB with Tf-IDF')
Now, look at the matrix carefully!

This confusion matrix above confirms that this new model is slightly better (and its accuracy score is 94.4 %).
However, too much fake news is still labeled as true news. Let’s try with another model called Passive-aggressive Classifier which is special for text classification purposes.
3. Passive Agressive Classifier With Count Vectorizer
The passive-aggressive classifier is an algorithm that learns from huge piles of data. The idea is to get an example, update the classifier, and throw away the example.
Passive and Agressive!
from sklearn.linear_model import PassiveAggressiveClassifier
linear_classifier = PassiveAggressiveClassifier(max_iter=10)
linear_classifier.fit(count_train, y_train)
pred_linear_count = linear_classifier.predict(count_test)
acc_linear_count = metrics.accuracy_score(y_test, pred_linear_count)
print(acc_linear_count)
cm6 = metrics.confusion_matrix(y_test, pred_linear_count, labels=[0,1])
plot_confusion_matrix(cm6, classes=['TRUE','FAKE'], title ='Confusion matrix for a PA Classifier with Count Vectorizer')
Look at the confusion-matrix and accuracy score carefully!
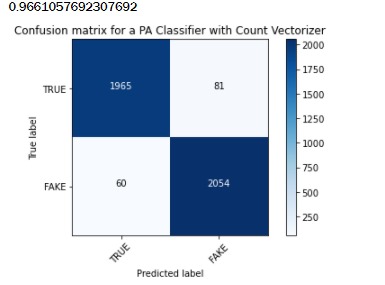
We get much better results than with the MultinomialNB model, both in terms of accuracy (96.61%) and in terms of false negative. Only 60 fake news were labeled as true news this time.
Let’s try with the Tf-IDF method.
4. Passive Agressive Classifier With TF-IDF Vectorizer
Let’s do the same with TF-IDF Vectorizer and compare results.
linear_classifier = PassiveAggressiveClassifier(max_iter=10)
linear_classifier.fit(tfidf_train, y_train)
pred_linear_tfidf = linear_classifier.predict(tfidf_test)
acc_linear_tfidf = metrics.accuracy_score(y_test, pred_linear_tfidf)
print(acc_linear_tfidf)
cm5 = metrics.confusion_matrix(y_test, pred_linear_tfidf, labels=[0,1])
plot_confusion_matrix(cm5, classes=['TRUE','FAKE'], title ='Confusion matrix for a PA Classifier with Tf-IDF')
Look at the awesome score generated, and also properly visualize the confusion matrix!

Although we observe more false negatives, the overall accuracy is much better, hence so far this is our best model.
Let’s try with Logistic Regression now !
5. Logistic Regression with TF-IDF Vectorizer
Logistic regression is a statistical model that in its basic form uses a logistic function to model a binary dependent variable, although many more complex extensions exist. In regression analysis, logistic regression (or logit regression) is estimating the parameters of a logistic model (a form of binary regression). – Wikipedia
Let’s get hands-on with this model now!
logreg = LogisticRegression(C=1e5)
logreg.fit(tfidf_train, y_train)
pred_logreg_tfidf = logreg.predict(tfidf_test)
pred_logreg_tfidf_proba = logreg.predict_proba(tfidf_test)[:,1]
acc_logreg_tfidf = metrics.accuracy_score(y_test,pred_logreg_tfidf)
print(acc_logreg_tfidf)
cm4 = metrics.confusion_matrix(y_test, pred_logreg_tfidf, labels=[0,1])
plot_confusion_matrix(cm4, classes=['TRUE','FAKE'], title ='Confusion matrix for a Logistic Regression with Tf-IDF')
Let us quickly hover through the accuracy score and output.
0.9805288461538462
This model has a very high accuracy score, and only 58 records were misclassified.
So far, Logistic Regression played it best! Let’s see the same with the CountVectorizer i.e. Bag of Words concept.
6. Logistic Regression with CountVectorizer
Let’s code it first!
logreg = LogisticRegression(C=1e5)
logreg.fit(count_train, y_train)
pred_logreg_count = logreg.predict(count_test)
acc_logreg_count = metrics.accuracy_score(y_test,pred_logreg_count)
print(acc_logreg_count)
cm3 = metrics.confusion_matrix(y_test, pred_logreg_count, labels=[0,1])
plot_confusion_matrix(cm3, classes=['TRUE','FAKE'], title ='Confusion matrix for a Logistic Regression with Count Vectorizer')
Next, we will have a look at the confusion matrix, along with the output.
0.9776442307692308
That’s a decent result.
Indeed, even though the accuracy score is a bit lower, we have less fake news labeled as true news i.e. only 44.
Finally, we will choose the best model, for classifying fake news!
Step 4: Opting for the best model for News Classification
Logistic Regression with CountVectorizer is the best model if we keep all the factors judged by looking at the outputs and confusion matrices!
Though the accuracy score is a bit lower, we have less fake news labeled as true news i.e. only 44. Therefore, we should choose this model because it seems to maximize the accuracy while minimizing the false negative rate!
And, with this we reached the end of a great study case in AI!
Hope you had fun and learned a lot at the same time!
We hope these simple projects would be useful for giving a quick glance for mini project ideas in your institutes too.
Click mini-project to explore more such projects.
Also to read about the latest technologies in computer science, you can visit the Technology News section on our website.
If you have queries regarding this ” Fake News Classifier with NLP“, you can write it down in the comment section below.
You can check out our other projects with source code below-
- Spam Email Detection using Machine Learning Projects for Beginners in Python (2021)
- Hands-on Exploratory data analysis python Code & Steps -2021
- Interesting python project (2021) Mouse control with hand gestures.
- Best (2021) Python Project with Source Code
- Live Color Detector (#1 ) in Python 2021
- List of 9 Best Statistics Book for Data Science India 2021
Feel free to open further discussions and contributions to this project by reaching me out on LinkedIn, GitHub, and Medium!
Happy Machine Learning!