Topic – Customer Churn Prediction Using Machine Learning | 2022
What on earth is Churn Prediction?
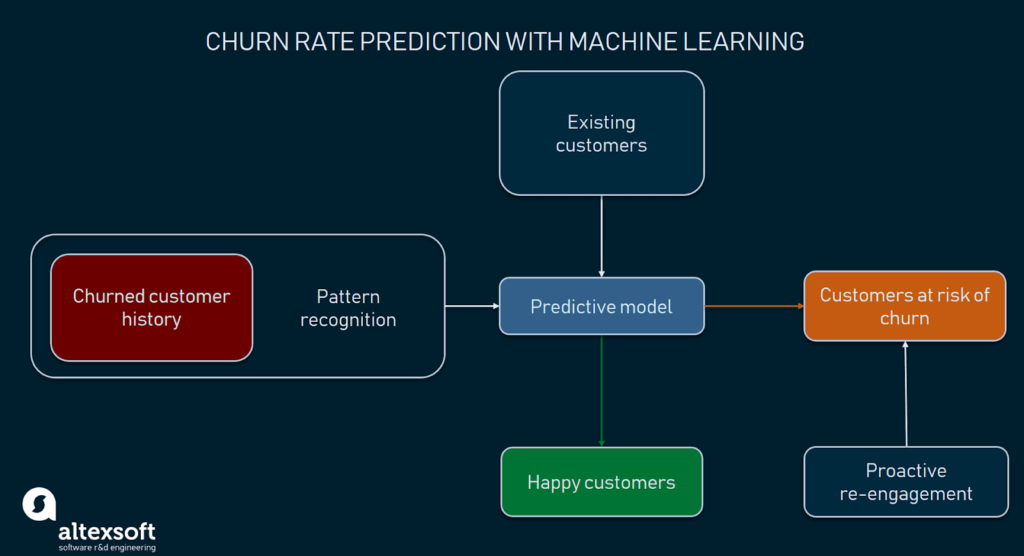
Customer attrition, customer turnover, or customer defection refer to the loss of clients or customers, ie, churn.
Churn prediction means detecting which customers are likely to cancel a subscription to a service based on how they use the service.
It is a critical prediction for many businesses because acquiring new clients often costs more than retaining existing ones.
Why Churn Prediction is so important?
Customer churn is a common problem across businesses in many sectors. If you want to grow as a company, you have to invest in acquiring new clients.

“Churn Rate is measured to give businesses an indicator on where it’s headed ie. it is the core metric around a company’s business health.”
Hence, predicting churn is a fact of life for any subscription business.
In this customer churn prediction using machine learning, you will learn and explore a predictive analytic machine learning model to predict a customer’s churn.
Steps we will cover and explore in customer churn prediction using machine learning –
- Download the data from Kaggle forum.
- Explore and gain valuable insights from the data.
- Create and train our machine learning model to predict customer churn.
- Evaluate our model metrics to see how well it performs on test data.
These are the 4 steps we will be covering in customer churn prediction using machine learning.
So, let’s dive in!
Step 1: Download the data from Kaggle forum
Kaggle, a subsidiary of Google LLC, is an online community of data scientists and machine learning practitioners.
Kaggle is the world’s largest data science community with powerful tools and resources to help you achieve your data science goals.
For this case study on customer churn prediction, we will use the famous datasets provided by IBM Global Services, available for free in Kaggle.
Download it from here – Telco Customer Churn
Step 2: Explore and gain valuable insights from the data
Let’s do an Exploratory Data Analysis to gain effective information from the data.
Accordingly, we will import the libraries required for doing the analysis.
import pandas as pd
import numpy as np
import matplotlib.pyplot as plt
%matplotlib inline
%config InlineBackend.figure_formats = [‘retina’]
import seaborn as sns
import time
import warnings
warnings.filterwarnings(“ignore”)

from sklearn.model_selection import KFold, cross_val_score
from sklearn.linear_model import LogisticRegression
from sklearn.neighbors import KNeighborsClassifier
from sklearn.naive_bayes import GaussianNB, BernoulliNB, MultinomialNB
from sklearn.tree import DecisionTreeClassifier
from sklearn.ensemble import RandomForestClassifier
from sklearn.svm import LinearSVC, SVC

from sklearn import metrics
from sklearn.metrics import confusion_matrix, classification_report
from sklearn.metrics import accuracy_score, precision_score, recall_score, f1_score, log_loss, fbeta_score
from sklearn.metrics import auc, roc_curve, roc_auc_score, precision_recall_curve
Furthermore, we will load and clean the data!
df = pd.read_csv(‘Telco-Customer-Churn.csv’)
# remove 11 rows with spaces in TotalCharges (0.15% missing data)
df['TotalCharges'] = df['TotalCharges'].replace(' ',np.nan)
df = df.dropna(how = 'any')
df['TotalCharges'] = df['TotalCharges'].astype(float)
# data overview
print ('Rows     : ', df.shape[0])
print ('Columns  : ', df.shape[1])
print ('\nFeatures : \n', df.columns.tolist())
print ('\nMissing values :  ', df.isnull().sum().values.sum())
print ('\nUnique values :  \n', df.nunique())
df.info()
df.isnull().sum()
Then we will get the churn value counts-
print(df.Churn.value_counts())
In this dataset of over 7000 customers, 26% of them has left in the last month.
Further, we will replace our categorical features with binary classes 1 and 0.
df[‘SeniorCitizen’] = df[‘SeniorCitizen’].replace({1:’Yes’,0:’No’})
num_cols = [‘tenure’, ‘MonthlyCharges’, ‘TotalCharges’]
df[num_cols].describe()
Then, we will do the feature selection with Statmodels library.
df1 = pd.read_csv(‘df1.csv’)
X, y = df1.drop(‘Churn’,axis=1), df1[[‘Churn’]]

from sklearn.linear_model import LassoCV, RidgeCV, ElasticNetCV
from sklearn.preprocessing import StandardScaler, PolynomialFeatures
print(‘Use LassoCV to find the optimal ALPHA value for L1 regularization’)
std = StandardScaler()
std.fit(X.values)

X_scaled = std.transform(X.values)
print(‘X_scaled’, X_scaled.shape)
alphavec = 10**np.linspace(-3,3,200)
lasso_model = LassoCV(alphas = alphavec, cv=5)

lasso_model.fit(X_scaled, y)
print(‘LASSO best alpha: ‘, lasso_model.alpha_ )

list(zip(X.columns, lasso_model.coef_))
Great! Our data is now ready to be modelled!
Step 3: Create and train our machine learning model to predict customer churn
Hence, we have our data processed and prepared for predictive modelling!
So, we will now focus on defining the features and labels, or simply, x and y, to nupy arrays!
# Def X and Y
y = np.array(data.Churn.tolist())
X = np.array(data.drop('Churn', 1))
Further, we will split our data into train and test parts.
# Train_test split
random_state = 42
X_train, X_test,y_train, y_test = train_test_split(X, y, test_size = 0.2, random_state = random_state)
Now we will train different Machine Learning models and see the accuracies and metrics!
- Support Vector Machines
from sklearn.metrics import classification_report
from sklearn.svm import SVC
sc = SVC(C=0.01, kernel='linear')
sc.fit(X_train,y_train)
svc_y_pred = sc.fit(X_train, y_train).predict(X_test)
print(classification_report(y_test, svc_y_pred))
Look at the report generated-
 precision    recall  f1-score   support

           0       0.85      0.91      0.88      1036
           1       0.69      0.57      0.63       373

    accuracy                           0.82      1409
   macro avg       0.77      0.74      0.75      1409
weighted avg       0.81      0.82      0.81      1409
It has given a brilliant accuracy of 82%!
Further, we will train a K Nearest Neighbor Classifier.
2. K Nearest Neighbor Classifier
from sklearn.neighbors import KNeighborsClassifier
knnm = KNeighborsClassifier(n_neighbors=10)
knnm.fit(X_train,y_train)
knnm.score(X_test,y_test)
Let us now look at the accuracy score-
0.7998580553584103It is a bit less than SVM! It gives an accuracy of ~80%.
3. Logistic Regression
from sklearn.linear_model import LogisticRegression
logm = LogisticRegression(C=0.1)
logm.fit(X_train,y_train)
logm.score(X_test,y_test)
log_y_pred = logm.fit(X_train, y_train).predict(X_test)
print(classification_report(y_test, log_y_pred))
Let us look at the classification metrics-
precision    recall  f1-score   support

           0       0.86      0.91      0.88      1036
           1       0.69      0.58      0.63       373

    accuracy                           0.82      1409
   macro avg       0.78      0.75      0.76      1409
weighted avg       0.81      0.82      0.82      1409
So, it also gives an accuracy similar to SVM, i.e. 82%!
Therefore, from the three best classifiers, we can imply now that Support Vector Machines and Logistic Regression works best on customer churn data!
Hurray! You learned how to predict customer churn!
Concluding customer churn prediction using machine learning
Bringing it all together, predicting customer churn is important. Effective action can be taken to retain the customer before it is too late.
Hence, I hope you had a good time learning customer churn prediction using machine learning.
This is an important business case study with the latest machine learning techniques!
For more such articles, visit our mini-projects category. You can contact us in case of any queries!
